Reading the Territory is the stage where a Master Plan swaps the idealized city on paper for the city that actually exists. There are nine thematic mappings that turn into a diagnosis, and this post pairs each of them with the open datasets that feed the map.
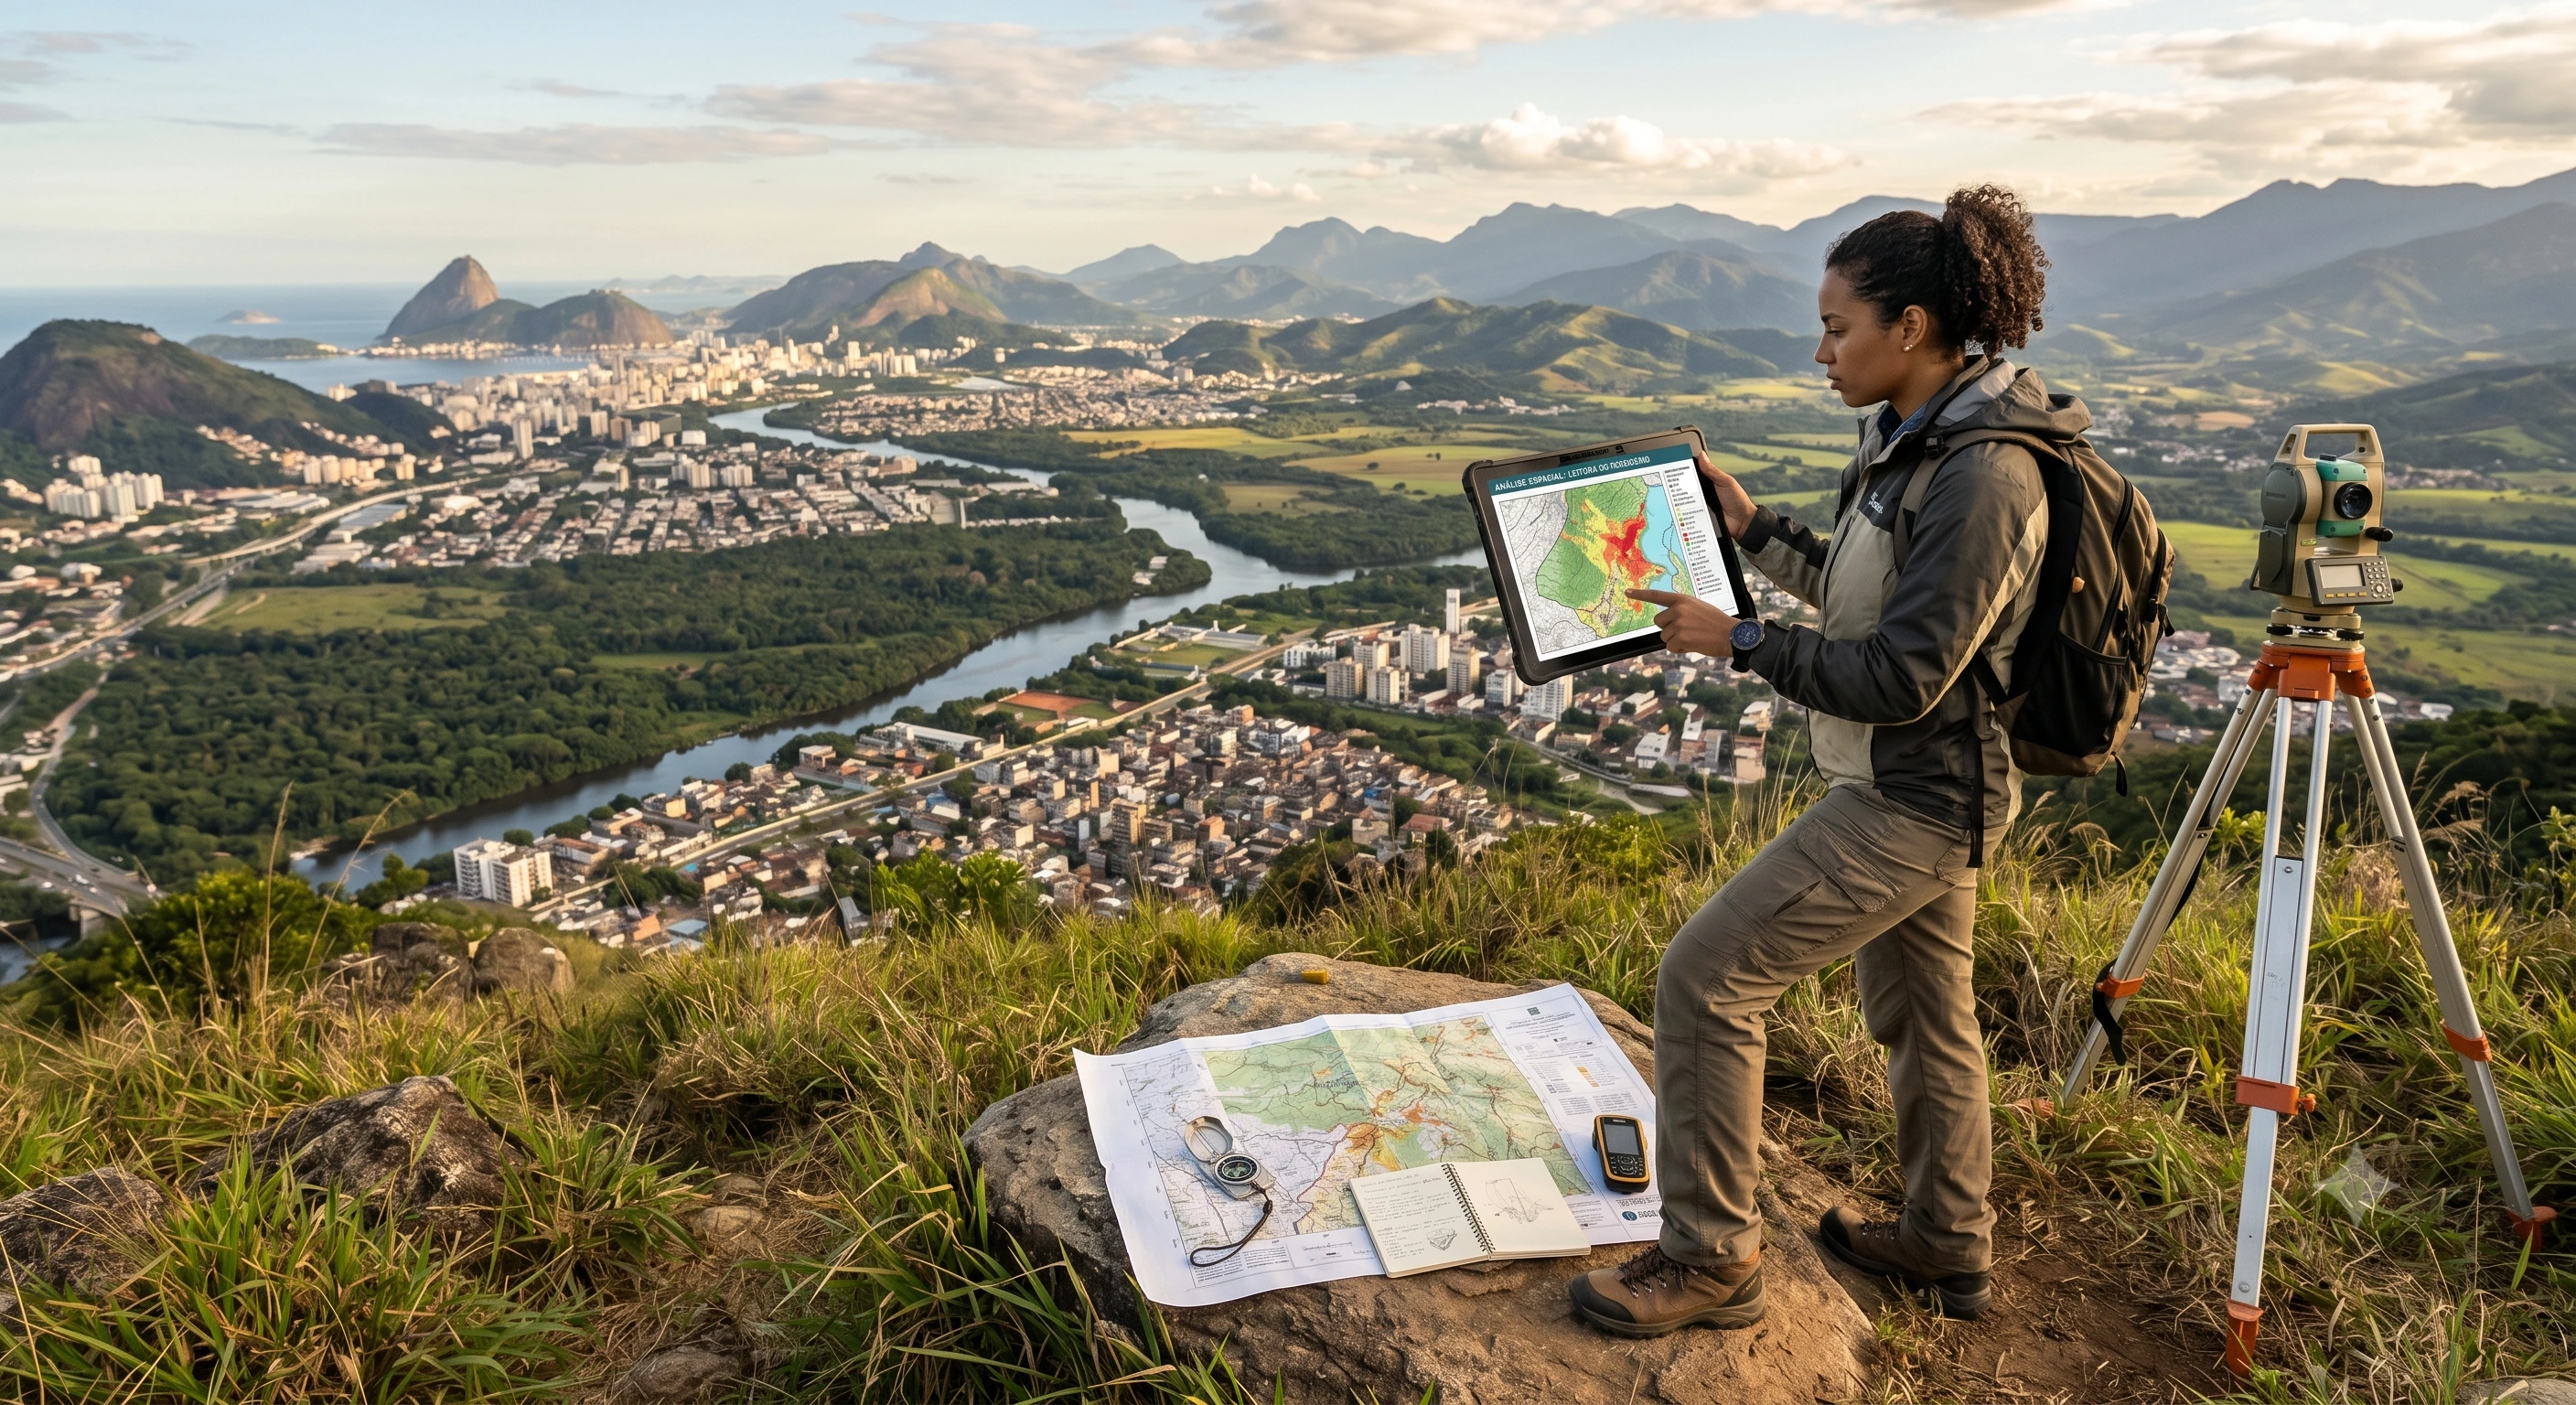
I have already laid out the five stages of drafting a Master Plan; Reading the Territory is the second, and the one that leans most heavily on GIS. The goal is to spatialize the problems: cross technical data with the community’s lived experience to pinpoint exactly where each phenomenon happens.
This reading rests on two kinds of survey. The basic ones are essential for municipalities of any size and rely on secondary data (Brazil’s IBGE censuses, MapBiomas) or the city’s own cadastres. The complementary ones are not mandatory but deepen the analysis. Both require a cartographic base, preferably georeferenced, organized into the thematic mappings below. The data sources cited are Brazilian, but most have direct equivalents in other countries.
1. Regional mapping
Basic: locates the regional road system, urban centers, watersheds, and Conservation Units of regional impact. Complementary: identifies employment, education, and health flows between neighboring municipalities, plus shared infrastructure such as landfills and reservoirs.
Open sources: IBGE (municipal boundaries and the BCIM continuous base map); IBGE’s REGIC study for inter-city flows and ties; ANA/SNIRH for watersheds; the National Registry of Conservation Units (MMA/ICMBio); and OpenStreetMap or DNIT for the road network.
2. Evolution of land occupation
Basic: through comparative aerial imagery across different years, maps the spread of the urban footprint and new rural settlements, including informal areas. Complementary: assesses the morphology of that occupation (verticalization, built density) and the advance of the agricultural frontier.
Open sources: the MapBiomas historical series (land cover and use since 1985) is the most direct route; INPE/TerraBrasilis for deforestation and fires; and Sentinel (Copernicus) and Landsat (USGS) imagery for custom multi-date composites.
3. Characterizing the population
Basic: identifies population concentration and breaks it down by income, gender, race/color, and age, also mapping the presence of people experiencing homelessness. Complementary: investigates people’s perception of safety, lighting, and access to services.
Open sources: the IBGE Demographic Census, especially the Census Tract Information Base (the finest spatial level available) and SIDRA for aggregates; CadÚnico (Ministry of Social Development) helps locate low-income and homeless populations.
4. Land use and occupation
Basic: maps population density, vacant lots and plots (urban voids), built standards (height limits), and overlays these against the hydrographic system and extraction areas. Complementary: extends to leisure smallholdings, public land, land-tenure status, and façade profiles.
Open sources: IBGE census tracts for density; the municipal property cadastre (property tax records) for lots and height; MapBiomas for land use; ANA/SNIRH for hydrography; and ANM’s SIGMINE for mining concessions and extraction areas.
5. Infrastructure conditions
Basic: surveys the reach and capacity of water, sewage, waste collection, public lighting, and public facilities (schools, hospitals, squares), revealing above all the uncovered areas. Complementary: locates drainage, telecom gaps, illegal dumping spots, and chronic flooding areas.
Open sources: SNIS for water, sewage, waste, and drainage; CNES/DATASUS for health facilities; INEP’s School Census (and QEdu) for schools; and ANATEL open data for telecom coverage.
6. Environmental system and ecosystem services
Basic: uses the Rural Environmental Registry (CAR) and satellite imagery to locate springs, forests, Permanent Preservation Areas (APPs), and parks. Complementary: maps degraded areas, geotechnical charts, and the areas responsible for the municipality’s main ecosystem services.
Open sources: SICAR (the CAR base, with APPs, Legal Reserves, and property-level hydrography); MapBiomas and MapBiomas Água for cover and water resources; and the Geological Survey of Brazil (SGB/CPRM) for geotechnical and susceptibility charts.
7. Mobility conditions
Basic: maps the road hierarchy, bus lines and stops, areas served and unserved by public transport, bike lanes, and accessible routes. Complementary: maps freight flows and accident hotspots.
Open sources: OpenStreetMap for roads, bike lanes, and facilities; GTFS feeds published on municipal open-data portals for public transport; and, for accidents, municipal/state portals or open data from the federal highway police (PRF) and RENAEST/SENATRAN.
8. Housing conditions
Basic: spatializes precarious settlements, favelas, tenements, and informal subdivisions, crossing them with risk areas and the housing deficit. Complementary: identifies where low-income housing was produced over the last decade, the supply of affordable land, and its built standard.
Open sources: IBGE’s Subnormal Agglomerations for favelas and precarious settlements; the João Pinheiro Foundation for the municipal housing deficit; and SGB/CPRM together with CEMADEN for geological and hydrological risk areas.
9. Emissions and climate risks
Complementary: maps the municipality’s main greenhouse gas (GHG) emission sources across energy, land use, agriculture, industry, and waste, guiding mitigation.
Open sources: SEEG (emission estimates by municipality and sector); MapBiomas for land-use change; and AdaptaBrasil (MCTI) for climate risk and vulnerability indices.
From map to Summary Table
Consolidating these nine mappings, alongside community debate, produces the Territory Reading Summary Table: the spatial diagnosis that objectively shows where the problems to be tackled in the proposals stage are. One practical reminder: each dataset comes at a different scale, extent, and reference date; standardizing the coordinate system, the base year, and the territorial unit is half the work before any map makes sense.
If you are building the cartographic base for a Reading of the Territory and want to talk through how to combine these sources in QGIS, reach out by email (eng.dcamargo@outlook.com.br) or WhatsApp.
Reference
MINISTÉRIO DO DESENVOLVIMENTO REGIONAL; MINISTÉRIO DO MEIO AMBIENTE. Guia para Elaboração e Revisão de Planos Diretores. [S.l.: s.n., 2022].