The PISA 2025 school file holds 1,053 rows for Brazil. Expanded by the sampling weight, those 1,053 schools represent an estimated 51,846.5 schools. Counted row by row, the public sector is 83.57% of the Brazilian sample; expanded by the weight, it is 76.67%. Same data, same column, and the shift of -6.90 percentage points between the two figures is not a correction of anything: it comes from which of the two objects is being measured.
The PUF is a sample, not a register
The PISA Public Use File is what the OECD publishes with the schools and students actually surveyed in each cycle. It is no country’s school register. Brazil’s 1,053 rows in the school file are sampled schools, and its 30,140 rows in the student file are students sampled at the PISA target age.
Counting rows is therefore not counting schools. Adding up the rows of one category and dividing by the total number of rows answers a question about the sample (“what fraction of the surveyed schools is public?”), not about the country (“what fraction of Brazilian schools with 15-year-old students is public?”). The two questions have different answers, and the second one requires the weight.
What the weight does
Every PUF row carries the final weight from the sampling design: W_NRASCHBWT in the school file (labelled FINAL TRIMMED NONRESPONSE ADJUSTED SCHOOL WEIGHT) and W_FSTUWT in the student file (FINAL TRIMMED NONRESPONSE ADJUSTED STUDENT WEIGHT). The weight states how many units of the population each row stands for.
What matters is that this weight varies from row to row. In Brazil the mean is 49.2369 estimated schools per sampled school, but that is a mean, not a constant: the sample is not self-weighting. Because schools from different strata enter with different weights, the composition of the sample and the composition of the population estimate do not coincide. That is why the public share falls and the private share rises when counting gives way to expansion: the sample over-represents the public sector relative to the weight it carries in the estimated population of schools.
Schools: the four categories
The question that classifies the sector is SC013Q01TA, answered by the school principal. It has four responses with rows in Brazil, and all four are in the table below, including the two forms of non-response, because dropping them would change the denominator without saying so.
Sector (SC013Q01TA) |
Sample | % sample | Weighted (W_NRASCHBWT) |
% weighted | Δ pp |
|---|---|---|---|---|---|
| Public | 880 | 83.5708% | 39,748.7131 | 76.6661% | -6.9047 |
| Private | 116 | 11.0161% | 9,960.6427 | 19.2118% | +8.1957 |
| Not administered | 43 | 4.0836% | 1,761.8142 | 3.3981% | -0.6855 |
| No response | 14 | 1.3295% | 375.3325 | 0.7239% | -0.6056 |
| Total | 1,053 | 100% | 51,846.5025 | 100% |
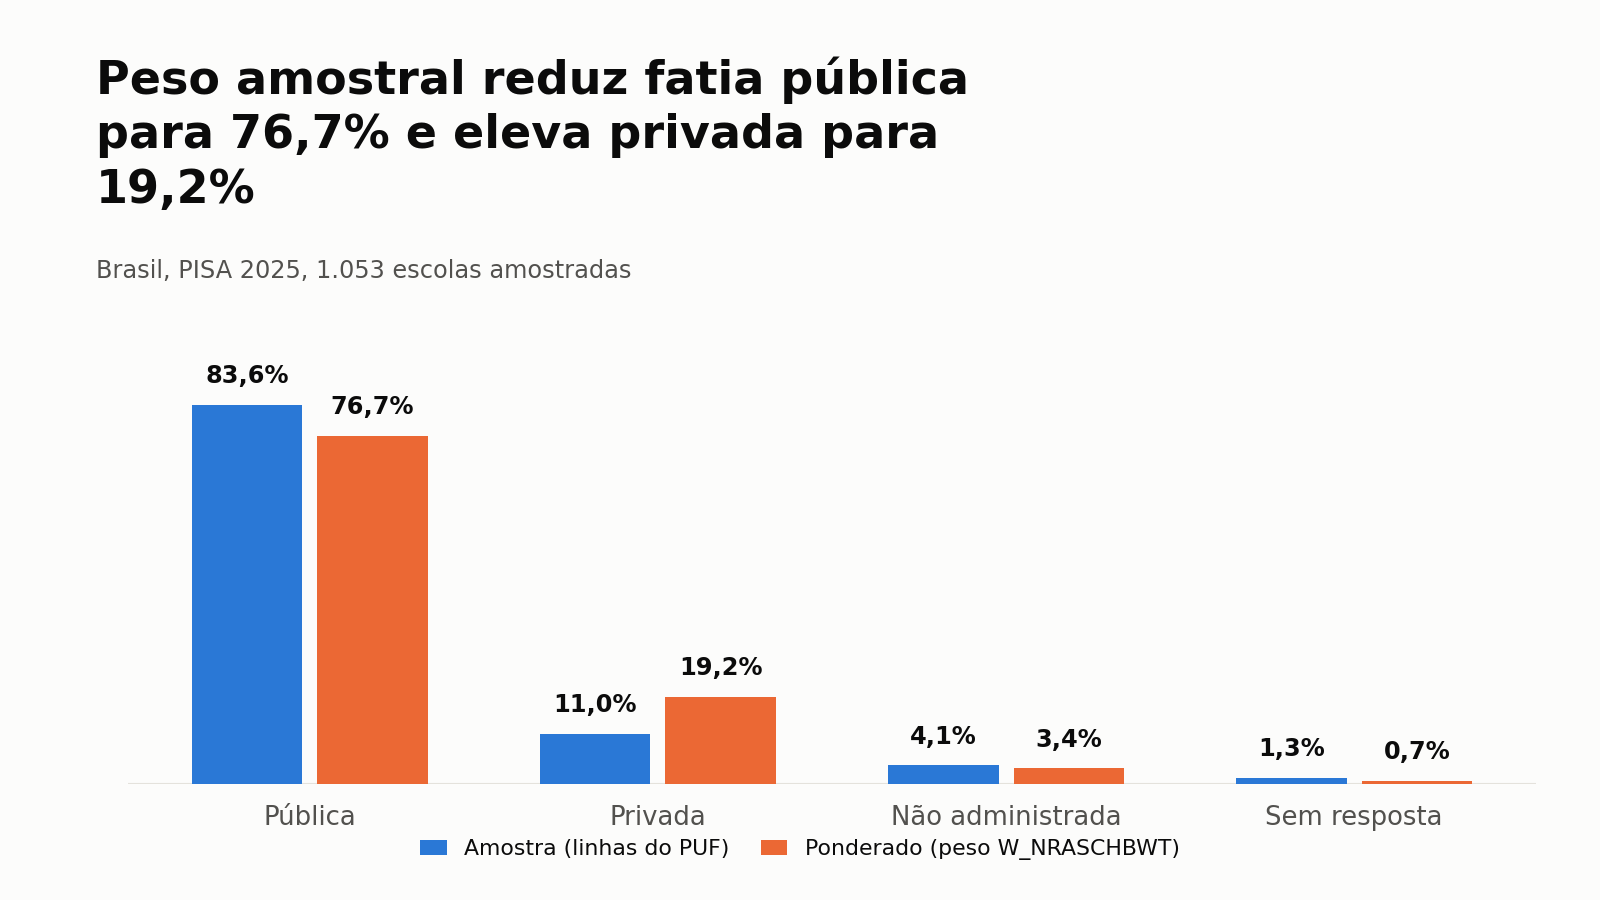
The private sector is the most visible case: 11.02% of the rows, 19.21% of the expanded estimate, a shift of 8.20 percentage points. Anyone quoting the first figure as “Brazil’s share of private schools in PISA” is describing the OECD sample, not the country.
Students: the same mechanism moving little
The same calculation on the student file, with the W_FSTUWT weight, produces a much smaller shift: Brazil’s 30,140 rows represent an estimated 2,184,649.9 students. Gender non-response in Brazil is zero, so the rows split into two categories only.
Gender (ST004D01T) |
Sample | % sample | Weighted (W_FSTUWT) |
% weighted | Δ pp |
|---|---|---|---|---|---|
| Female | 15,413 | 51.138% | 1,093,288.3685 | 50.0441% | -1.0939 |
| Male | 14,727 | 48.862% | 1,091,361.5331 | 49.9559% | +1.0939 |
| Total | 30,140 | 100% | 2,184,649.9016 | 100% |
The mean expansion factor here is 72.4834 estimated students per sampled student, and the gender composition moves 1.09 percentage points, against the 8.20 of the private sector. The reading is direct: the weight shifts the composition to the extent that the observed characteristic correlates with the weight. On the gender dimension the Brazilian sample is close to self-weighting, so weighting changes little. On the sector dimension it is not, and weighting changes a lot. The mechanism is the same in both cases; what differs is how much it has to move.
On which denominator
Every percentage above is calculated over Brazil’s total of sampled schools, the 1,053, with the 57 that did not report a sector included in the denominator. That choice is stated because it changes the result: over only the 996 schools that did report a sector, Brazil’s public share in the sample is 88.3534%, not 83.5708%.
This is already a recorded finding in this database. The sector question is not administered in every system: 8 countries and economies have 100% of their sampled schools with no response to it, and in Canada switching the denominator moves the public share by 24.65 percentage points. A public-sector percentage from this file that does not say which denominator produced it is a number that cannot be read.
The caveats, unsoftened
This analysis describes what the sampling weight does to the composition of the file, and nothing beyond that. Six limits, in order:
The PUF is a sample, not a register. The row counts are of schools and students surveyed by the OECD. No row count in this post should be read as a national total of institutions or enrolments.
The sector comes from the principal’s own statement. The public/private classification comes from the answer to SC013Q01TA in the school questionnaire, not from an administrative register. It is not directly comparable to the sector classification in INEP’s Censo Escolar, which has another origin and another rule.
One cycle only. These databases cover PISA 2025 strictly. Every comparison here is sample against weighted within the same cycle, never across cycles. Comparing with the previous PISA cycle, or with any older one, requires downloading that cycle’s files and redoing the harmonisation, which these files do not allow on their own.
The denominator is stated, and it matters. The percentages are over the total of sampled schools, including those that did not report a sector. Over the reported ones the figures are different, and the section above gives both.
Proficiency is out of scope. No PISA score enters this analysis. The plausible values were not used, and an official proficiency estimate requires combining the ten values and propagating the sampling error through the replicates, which is separate work.
The estimate is a point estimate, with no standard error. The replication weights distributed with the PUF were not used here. The weighted totals and percentages are point estimates, and this post claims nothing about their confidence interval.
What holds
When the file is a sample with unequal weights, counting rows and estimating a population are two different calculations over the same column, and both are right for different questions. The arithmetic closes either way. What I measure determines the answer. The only rule is to state what was measured.
Source: OECD, PISA 2025 Database. School questionnaire (CY09_MS_SCH_PUF.sav) and student questionnaire (CY09_MS_STU_PUF.sav), both Public Use Files of the CY09 cycle. The raw files have a recorded sha256, and the analysis, including the expansion by the W_NRASCHBWT and W_FSTUWT weights, is reproducible from them.